What Percentage of People Have Tattoos? 32% of US Adults
Guides · By CustomTattoo AI Editorial Team · Updated
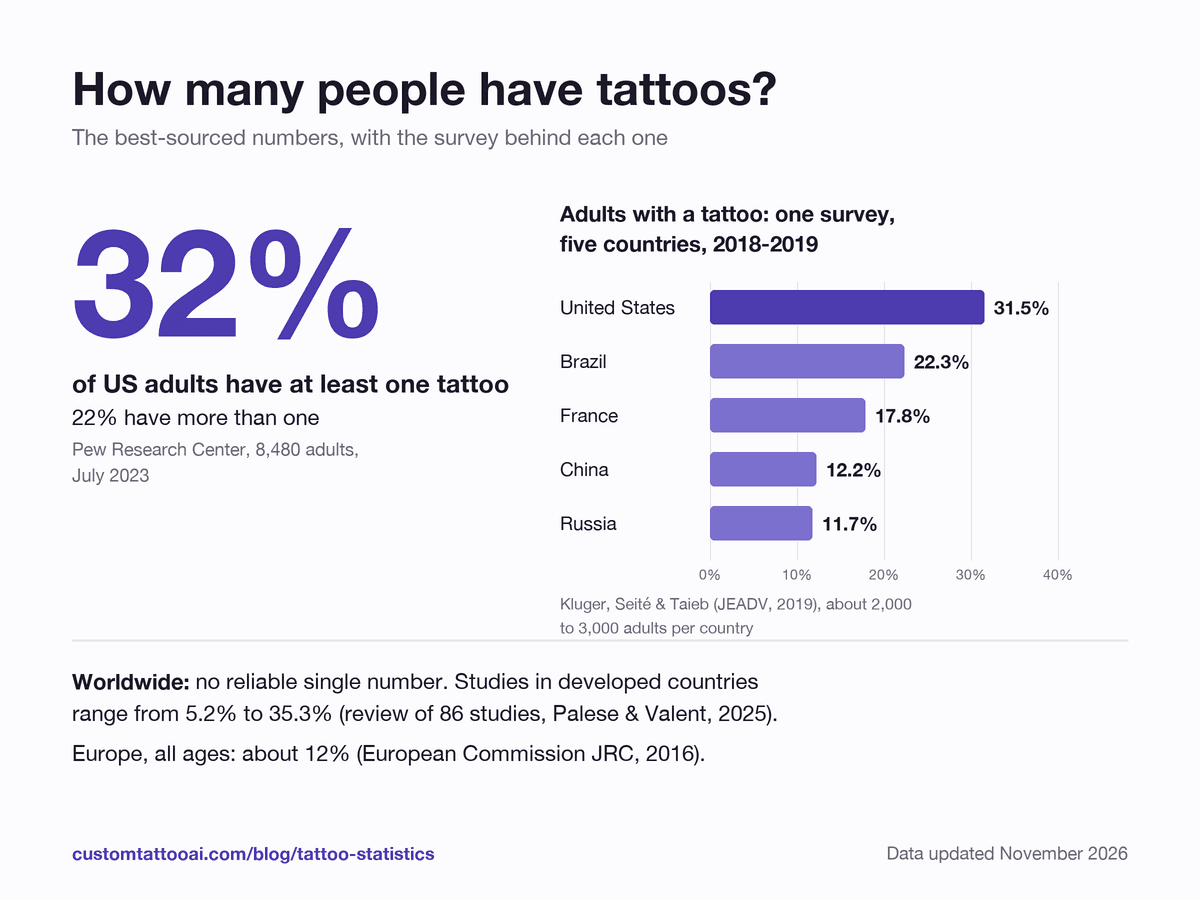
32% of US adults have at least one tattoo and 22% have more than one, according to Pew Research Center's July 2023 survey of 8,480 adults. Worldwide, no survey counts every tattooed person: a 2025 review of 86 studies found that 5.2% to 35.3% of people are tattooed in developed countries, and the European Commission estimates about 12% across Europe. Data updated November 2026: every figure on this page was checked against its source on November 11, 2026.
- of US adults have at least one tattoo
- 32%
- of US adults have at least one tattoo
- Pew, 2023
- of US adults have more than one
- 22%
- of US adults have more than one
- Pew, 2023
- US women vs men with a tattoo
- 38% vs 27%
- US women vs men with a tattoo
- Pew, 2023
- of US adults aged 30 to 49, the most tattooed age group
- 46%
- of US adults aged 30 to 49, the most tattooed age group
- Pew, 2023
- tattooed in developed countries, depending on the study
- 5-35%
- tattooed in developed countries, depending on the study
- Palese & Valent, 2025
- of tattooed US adults ever regret one
- 24%
- of tattooed US adults ever regret one
- Pew, 2023
What percentage of people in the US have tattoos?
About one in three adults. In Pew Research Center's survey conducted July 10 to 16, 2023, 32% of US adults said they have at least one tattoo and 22% said they have more than one. Respondents came from Pew's American Trends Panel, which is recruited through national random sampling of residential addresses, and the results are weighted to match the US adult population. Pew publishes a share, not a head count, so any precise number of tattooed Americans you see elsewhere is someone's own multiplication.
Pew is not the only US poll, and the others give lower numbers. The differences come from who was asked and how, not from a sudden change in tattooing:
| Survey (US adults) | Fieldwork | Has a tattoo | Sample |
|---|---|---|---|
| Pew Research Center | July 2023 | 32% | 8,480, address-based random panel |
| YouGov | Mar to Apr 2025 | 24% | 1,115, opt-in online panel |
| Ipsos (KnowledgePanel) | Aug 2021 | 26% | 1,016, address-based random panel |
| Ipsos | Aug 2019 | 30% | 1,005, opt-in online panels |
| Ipsos | Dec 2011 | 21% | 1,005, online panel |
Pew has the largest sample and the most recent random-sample fieldwork, which is why this page uses its 32% as the headline US figure. YouGov's 2025 poll is newer, but it relies on an opt-in panel of about 1,100 people and carries a margin of error of about 4 points.
US adults with at least one tattoo, by age
- 18 to 2941%
- 30 to 4946%
- 50 to 6425%
- 65 and older13%
- All adults32%
Adults aged 30 to 49 are the most tattooed group at 46%, slightly ahead of adults under 30 at 41%. The share falls to 25% between 50 and 64 and to 13% from 65.
How many people in the world have tattoos?
Nobody has counted. There is no worldwide survey with one method, so a single "global percentage" is always a guess. The most complete evidence is a 2025 literature review by Palese and Valent in the journal of Italy's National Institute of Health. It screened 7,921 records and kept 86 studies published between 2000 and 2025. Tattoo prevalence ranged from 0.18% to 63.9% across all the populations studied, and from 5.2% to 35.3% in developed countries, with a significantly increasing trend and higher rates among younger people.
Those extremes are not typical countries. The lowest figure (0.18%) comes from a study of 149,175 people of all ages in Jiangsu province, China; the highest (63.9%) from 430 people in an Indigenous community in the Brazilian Amazon. For Europe, the European Commission's Joint Research Centre estimates that around 12% of the whole population, all ages included, is tattooed, based on data from 14 member states (2016 report).
Adults with a tattoo: the same survey in five countries, 2018 to 2019
- United States31.5%
- Brazil22.3%
- France17.8%
- China12.2%
- Russia11.7%
This is the only recent peer-reviewed comparison we found that asked adults in several large countries the same question at the same time. The paper itself is paywalled, so the figures here are taken from the 2025 review's table. It puts the United States first, close to Pew's own figure, which is a useful cross-check. Five countries are not the world, though, so this page does not turn them into a global average.
Tattoo statistics by country
National figures are measured on different age groups and in different years, so the table gives both. Older rows are kept because, for several countries, nothing more recent and representative has been published.
| Country | Has a tattoo | Who was asked | Fieldwork | Source |
|---|---|---|---|---|
| United States | 32% | Adults 18+ | 2023 | Pew |
| Brazil | 22.3% | Adults 18+ | 2018-2019 | Kluger et al. |
| Canada | 22% | Adults 18+ (online) | 2011 | Ipsos |
| Norway | 20.8% | Ages 16 to 91 | Not stated | Sagoe et al., via review |
| Germany | About 1 in 5 | Ages 14 to 94 | 2016 | Leipzig University |
| France | 17.8% | Adults 18+ | 2018-2019 | Kluger et al. |
| Australia | 14.5% | Ages 16 to 64 | 2004-2005 | Heywood et al., via review |
| Denmark | 14.2% | Ages 24 to 76 | 2006 | Bjerre et al., via review |
| Italy | 12.8% | Ages 12+ | 2015 | ISS |
| China | 12.2% | Adults 18+ | 2018-2019 | Kluger et al. |
| Russia | 11.7% | Adults 18+ | 2018-2019 | Kluger et al. |
| Netherlands | 9.8% | Not stated | 2013 | Dillingh et al., via review |
| Europe (whole) | About 12% | All ages | Report 2016 | EU JRC |
The United Kingdom has no recent national survey in the 2025 review. The only UK entry is a 2014 to 2015 study of 378 people in Greater London (25.7%), too small and too local to stand for the country, so it is not in the table. For Australia, the most recent representative figure in the review dates from 2004 to 2005 and is likely out of date. Rows marked "via review" are quoted from Table 1 of Palese and Valent (2025); we did not open those original papers.
What percentage of men and women have tattoos?
In the US, 38% of women and 27% of men have at least one tattoo (Pew, 2023). The gap is widest among young adults: 56% of women aged 18 to 29 have a tattoo, compared with 26% of men the same age, according to the Survey Center on American Life's reading of the Pew data. Among women aged 30 to 49, 53% are tattooed. YouGov's 2025 poll shows the same direction with lower levels: 30% of women and 19% of men, and 21% of women versus 12% of men with more than one tattoo.
| US adults, 2023 | Has at least one tattoo |
|---|---|
| Women | 38% |
| Men | 27% |
| Lesbian, gay or bisexual adults | 51% |
| LGB women | 68% |
| Straight adults | 31% |
| Black | 39% |
| Hispanic | 35% |
| White | 32% |
| Asian | 14% |
| Some college or less | 37% |
| Bachelor's degree | 24% |
| Postgraduate degree | 21% |
| Lower income | 43% |
| Middle income | 31% |
| Upper income | 21% |
| Religiously unaffiliated | 41% |
| Religiously affiliated | 29% |
Source: Pew Research Center, 2023. Pew found no major difference by political party, by urban, suburban or rural community, or between veterans and non-veterans: roughly a third of each group is tattooed. These are group-level estimates that describe the population, not any individual.
Who gets more tattoos, men or women?
It depends on the country. In the US, women are clearly ahead. Elsewhere the direction changes, and the 2025 review concludes that findings on sex differences are inconsistent. In the five-country survey by Kluger and colleagues, women led in the US (35.1% vs 27.8%) and Brazil (24.4% vs 20.0%), men led in France (19.5% vs 16.2%) and Russia (15.0% vs 8.9%), and China was level (12.2% of women, 12.1% of men). Italy's national survey found 13.8% of women and 11.7% of men.
What percentage of Gen Z and millennials have tattoos?
Pew reports age groups, not generations, so a "Pew millennial figure" does not exist, even though some summaries label Pew's 30 to 49 group as millennials. The most recent survey that does publish generations is an Ipsos poll on its probability-based KnowledgePanel, conducted August 27 to 30, 2021, with 1,016 US adults.
US adults with at least one tattoo, by generation (2021)
- Gen Z (18 to 25) · n = 10023%
- Millennials (26 to 39)41%
- Gen X (40 to 55)32%
- Baby Boomers (56+)13%
- All adults26%
Two in five millennials had a tattoo in 2021, the highest of any generation. Gen Z's 23% comes from only 100 interviews with people who were 18 to 25 at the time, and the survey did not ask why they had or had not been tattooed. Pew's 2023 data point the same way, with 41% of 18 to 29 year olds tattooed and 19% of untattooed adults under 30 saying they are extremely or very likely to get one, against 7% of those aged 30 to 49.
For "what percentage of Gen Z women have tattoos", the closest sourced figure is Pew's 56% of women aged 18 to 29 in 2023. That age band covers most adult Gen Z women at the time, plus some young millennials, so it is an age figure, not a generation figure.
How many tattoos does the average person have?
Most tattooed people have more than one. In Pew's 2023 data, 22% of all adults have several tattoos out of 32% who have any, which means about seven in ten tattooed Americans have more than one (our calculation from Pew's figures).
- Average among people with several tattoos: 4.3. Ipsos asked 171 adults with multiple tattoos how many they have. Two was the most common answer (33%), 20% had three, and 11% had ten or more; the mean was 4.3 (Ipsos, August 2019). Ipsos's press release rounds this to "four" for tattooed Americans, but the question was only asked of people with more than one.
- Spread across all adults: 8% have one tattoo, 8% have two or three, 4% have four or five and 5% have six or more (YouGov, 2025).
- No reliable median for everyone with a tattoo. No survey we found asks every tattooed person the exact count, so any single figure for the average person is an estimate.
Prompt to try
“small matching fine line tattoo set of three tiny symbols, black ink, inner forearm”
Generate this designWhy do people get tattoos?
Memory comes first. Among tattooed US adults, 69% said honoring or remembering someone or something was a reason for getting at least one of their tattoos. Respondents could choose several reasons, so the percentages overlap.
 69%Honor or remember someone or something
 47%Make a statement about their beliefs
 32%Improve their appearance
Women were more likely than men to cite remembrance (73% vs 63%). Black adults were the most likely to cite a statement about beliefs (56%) and appearance (42%).
Remembrance tattoos often rely on names, dates and short words, where one wrong letter or digit is permanent. If that is your plan, check the exact text with the name tattoo generator or convert a date with the Roman numeral tattoo generator before you book.
Prompt to try
“guardian angel tattoo honoring a loved one, fine line, black ink, for the upper arm”
Generate this designHow many people regret their tattoos?
Between about one in ten and one in four, depending on how the question is asked. In Pew's 2023 survey, 24% of tattooed adults said they ever regret getting one or more of their tattoos. Ipsos asks a stricter either-or question, "happy with your tattoos or regret the decision": 12% chose regret in 2021, 8% in 2019 and 11% in the US in late 2011, when 10% of tattooed Canadians said the same.
In Pew's data, regret was reported by about three in ten tattooed Hispanic adults, 23% of White adults and 21% of Black adults, and by 25% of those with some college or less versus 19% of those with a bachelor's degree or more. In the 2021 Ipsos poll, Baby Boomers were the most likely to regret (19%). Neither survey published the reasons for regret, and we found no reliable national figure for how many people actually have a tattoo removed.
Pew did not test what prevents regret, so this page makes no claim about it. Practical planning steps such as checking the size against your body and previewing the placement are covered in the tattoo size guide and the tattoo visualizer guide.
Are tattoos becoming more common?
Yes, in the long run, though the exact growth rate depends on the survey. The 2025 review reports a significantly increasing trend across the 86 studies. Ipsos, asking the same question each time, found 21% of US adults tattooed in 2011, 30% in 2019 and 26% in 2021, a pattern that shows how much the sample method moves the result: the 2021 poll used a different, probability-based panel. Pew's 2010 telephone survey found 23%, against 32% in 2023, but Pew warns the two are not directly comparable because the survey mode and question wording changed.
In Europe, the Italian National Institute of Health summarizes European Chemicals Agency figures based on JRC survey data: almost 30 million tattooed people in the EU in 2003 and more than 62 million in 2014. Attitudes have moved too: 80% of US adults say society has become more accepting of people with tattoos over the past 20 years, 12% say it has stayed about the same and 7% say it has become less accepting.

Among adults without a tattoo, two thirds (66%) say a tattoo makes neither a more positive nor a more negative impression, while 29% say it makes a more negative one. Older adults are the most critical: 40% of untattooed adults aged 65 and older lean negative. Overall, 85% of untattooed adults say they are not too or not at all likely to get one.
How to read a tattoo statistic
Many pages titled with the current year recycle the same few numbers without dates or methods. Before you quote a tattoo statistic, check four things:
- Who was asked. Adults only, teenagers included, or the whole population? Germany's survey covers ages 14 to 94, Italy's starts at 12 and Pew's covers adults.
- How they were recruited. Probability samples (random addresses or phone numbers) represent a country better than opt-in online panels, which tend to show much higher rates.
- When it was collected. The strongest US figure is from July 2023; most European and Australian estimates date from 2004 to 2019.
- What was counted. Having at least one tattoo, having several, and regretting one are different questions with different answers.
Methodology and how to cite this page
We only use published surveys and peer-reviewed studies that state who was asked, when and how. Every number is quoted as published; the only figures we computed are labelled as our calculation. We do not combine surveys into a world average, because their age groups and sampling methods differ. Online opt-in polls are shown separately from random-sample surveys. Figures quoted from a review table rather than the original paper say so; this applies to the five-country survey, whose full text is paywalled. Sources were last opened on November 11, 2026, and this page will be updated when Pew or another national survey publishes newer data.
What percentage of people have tattoos?+
In the US, 32% of adults have at least one tattoo and 22% have more than one (Pew Research Center, July 2023). Worldwide there is no single figure: a 2025 review of 86 studies found 5.2% to 35.3% of people tattooed in developed countries, and about 12% of Europeans are tattooed (European Commission JRC).
How many people in the world have tattoos?+
No one has counted. Published studies range from 0.18% to 63.9% depending on the population, and from 5.2% to 35.3% in developed countries (Palese and Valent, 2025). In one survey of five large countries in 2018 to 2019, the share of adults with a tattoo ranged from 11.7% in Russia to 31.5% in the US.
What percentage of men have tattoos?+
27% of US men have at least one tattoo, compared with 38% of US women (Pew, 2023). Among adults aged 18 to 29, 26% of men and 56% of women are tattooed. In France and Russia, men are more likely than women to have one.
What percentage of Gen Z have tattoos?+
In an Ipsos KnowledgePanel poll from August 2021, 23% of Gen Z adults (then aged 18 to 25) had a tattoo, compared with 41% of millennials (26 to 39). Pew does not report generations; it found 41% of US adults aged 18 to 29 tattooed in 2023.
How many tattoos does the average person have?+
About seven in ten tattooed Americans have more than one (calculated from Pew, 2023). Among people with several tattoos, Ipsos measured an average of 4.3 in 2019, and two was the most common number.
What percentage of people regret their tattoos?+
24% of tattooed US adults say they ever regret one or more of their tattoos (Pew, 2023). When asked to choose between being happy with their tattoos or regretting them, 12% chose regret (Ipsos, 2021).
Sources
- Pew Research Center: 32% of Americans have a tattoo, including 22% who have more than one (Schaeffer and Dinesh, August 15, 2023) · checked November 11, 2026
- Palese F, Valent F. Worldwide prevalence of tattoos with a focus on younger age groups: a literature review. Ann Ist Super Sanità 2025;61(4):301-314 · checked November 11, 2026
- Kluger N, Seité S, Taieb C. The prevalence of tattooing and motivations in five major countries over the world. JEADV 2019;33(12):e484-e486 (figures read from Palese and Valent, Table 1) · checked November 11, 2026
- Ipsos: One in four Americans have at least one tattoo, topline and methodology (KnowledgePanel, August 27 to 30, 2021) · checked November 11, 2026
- Ipsos: More Americans have tattoos today than seven years ago, topline (August 27 to 28, 2019) · checked November 11, 2026
- Ipsos: Two in ten Canadians (22%), Americans (21%) have a tattoo (January 23, 2012) · checked November 11, 2026
- YouGov: Americans have become more favorable toward tattoos in past decade (Ballard, April 26, 2025) · checked November 11, 2026
- Survey Center on American Life: Why are so many Gen Z women getting tattoos? (Cox, April 16, 2026) · checked November 11, 2026
- European Commission JRC: Safety of tattoos and permanent make-up, state of play and trends in tattoo practices (2016) · checked November 11, 2026
- Renzoni et al., The tattooed population in Italy: a national survey (Annali dell'Istituto Superiore di Sanità, 2018) · checked November 11, 2026
- Istituto Superiore di Sanità, EpiCentro: tattoo epidemiology in Europe (ECHA and JRC figures) · checked November 11, 2026
- News4teachers: Leipzig University survey on tattoos in Germany (Brähler and Borkenhagen, October 2017) · checked November 11, 2026
- Newsweek: Which country has the most people with tattoos? (Dalia Research online survey, 2018) · checked November 11, 2026
Styles, ideas and trends
- Tattoo styles explained
One rose drawn in 8 styles, and how to choose yours.
- Tattoo styles
Fine line, blackwork, traditional, realism, Japanese and more.
- Tattoo ideas
Meanings, designs and placements for 36 tattoo ideas.
- Small tattoo ideas
48 small designs by theme, with a size and spot for each.
- Forearm tattoo ideas
30 forearm designs, from small marks to half sleeves.
- Minimalist tattoos
What makes a design minimal, and how minimal tattoos age.
- Tattoo idea generator
Turn a meaning or a memory into tattoo directions.
- Script tattoos
Lettering styles, sizes and how many characters fit.